Debugging Production Performance Problems
I walk through how to debug a slow API endpoint using RUM data, Node.js CPU profiles, flamegraphs, and database slow query logs — a step-by-step process for finding what's actually slow.
An API endpoint starts responding slowly. Users complain. You check the server logs and see no errors. You deploy nothing. The metrics look… fine, mostly. You add a console.time around a few suspect functions and the numbers look reasonable. And yet the endpoint is still slow for real users.
This is the most frustrating kind of production problem. No crash, no stack trace, no obvious culprit. Just slowness that your local environment doesn’t reproduce.
The reason most performance debugging stalls here is the same reason most debugging stalls: we look at the wrong evidence first. We reach for console.log, add some guesses, and hope something jumps out. A better approach is to work from the outside in — start with what real users actually experienced, then narrow down to the exact function or query that caused it.
I’ll walk through that process: starting with RUM (Real User Monitoring) data, dropping into Node.js CPU profiling and flamegraphs, checking the database slow query log, and using clinic.js to validate the fix.
Series: Part 4 of 4 — the finale. Previous: React Performance: Finding and Fixing Slow Components
On this page
- Start with RUM, not with a guess
- Capture a CPU profile with –inspect
- Read the flamegraph
- Check the database slow query log
- A complete profiling walkthrough
- When profiling is overkill
- Profile before you guess, then trust the data
Start with RUM, not with a guess
Real User Monitoring collects timing data from the actual browsers and devices of your users. Unlike synthetic tests — where you measure the endpoint from a controlled environment — RUM shows you what the 95th-percentile user actually waited for.
The most important number here isn’t average response time. It’s the p95 or p99. An average can look healthy while a large portion of your users are having a consistently bad experience.
When you look at your RUM data, try to answer these questions first:
- Which specific endpoint is slow? A catch-all “the app is slow” report is not useful yet.
- Is it slow for everyone or for a specific segment? Device type, geography, and connection speed all affect perceived latency — but if the slowness correlates to server response time specifically (not network or render time), those segments don’t matter.
- When did it start? A performance regression that started after a specific deploy points to a code change. Gradual slowdown over weeks suggests data growth or a missing index.
- What does the waterfall look like? The network timing tab in most RUM tools breaks the response into DNS, TCP, TTFB (time to first byte), and download. If TTFB is high, the problem is on the server. If download is slow, the response payload is too large.
TTFB being high is your signal to stop looking at the frontend and start profiling the backend.
Try this
- Open the network tab in your browser’s DevTools.
- Make the slow API request.
- Click on the request and look at the Timing tab.
Expected result: You’ll see a breakdown into Queueing, Stalled, DNS Lookup, Initial connection, Request sent, Waiting (TTFB), and Content Download. If “Waiting” is the dominant time, the problem is server-side. If “Content Download” is dominant, you’re sending too much data.
Capture a CPU profile with –inspect
Once you’ve confirmed the slowness is in the server and identified which endpoint, the next step is to see where the CPU time actually goes. Node.js has a built-in profiler that works through the V8 inspector.
Start your server with the --inspect flag:
node --inspect server.jsOr for a running process — useful when you can’t restart without affecting production — send SIGUSR1:
kill -SIGUSR1 <pid>Node.js will print something like Debugger listening on ws://127.0.0.1:9229. Open Chrome and navigate to chrome://inspect. Click Open dedicated DevTools for Node.
Once connected:
- Click the Profiler tab.
- Hit Start.
- Send several requests to the slow endpoint (using
curlorab). - Hit Stop.
The profiler collects V8 ticks — samples of what the call stack looked like at regular intervals. The resulting profile shows you which functions consumed the most CPU time.
The alternative is the --prof flag, which writes a tick file:
NODE_ENV=production node --prof server.jsThen process it with:
node --prof-process isolate-0xnnnn-v8.log > processed.txtThe [Summary] section tells you the split between JavaScript, C++, and garbage collection. The [C++] section lists the C++ functions consuming the most samples. The [Bottom up (heavy) profile] section shows you the callers of each heavy function — which is often where the real story is.
The Node.js official documentation covers this workflow in detail, including an example where crypto.pbkdf2Sync appears responsible for most CPU time until it’s replaced with its async equivalent.
Check this before moving on
- You identified which endpoint is slow using TTFB data, not just a hunch
- The Node.js profiler is attached and collecting samples under real load
- You have a tick file or a Chrome DevTools profile to inspect
Read the flamegraph
A flamegraph is a way to visualise a CPU profile. Each frame in the call stack becomes a horizontal bar. Width represents how much CPU time that function consumed. The call stack grows upward — the root call (your request handler) sits at the bottom, and deep nested calls appear near the top.
The official Node.js documentation recommends 0x as the easiest way to generate one:
npx 0x server.jsUnder load, 0x collects stack samples and renders an interactive SVG flamegraph in your browser when you stop it with Ctrl+C.
What you’re looking for:
- Wide, flat bars at the top of the stack. A function that appears wide and sits near the top has no children consuming time — the time stops here. This is where the work is actually happening.
- Unexpectedly wide bars in the middle. A middleware or utility function that appears wide and deep in the call stack is accumulating time across many calls.
- Orange or red bars (in tools that colour-code by heat). These indicate functions where V8 hasn’t JIT-compiled the code — they’re running interpreted, which is slower.
On Linux, you can also use perf to capture samples from a running process without restarting it:
perf record -F99 -p $(pgrep -n node) -g -- sleep 10
perf script > perfs.out
The -F99 flag samples at 99 Hz. The sleep 10 keeps perf running for 10 seconds against the target PID. You then feed perfs.out into flamegraph.pl or upload it to flamegraph.com for visualisation.
One important note: on Node.js 10+, use --interpreted-frames-native-stack alongside --perf-basic-prof-only-functions to get readable function names in the graph. Without these flags, many frames appear as v8::Function::Call and the graph becomes hard to read.
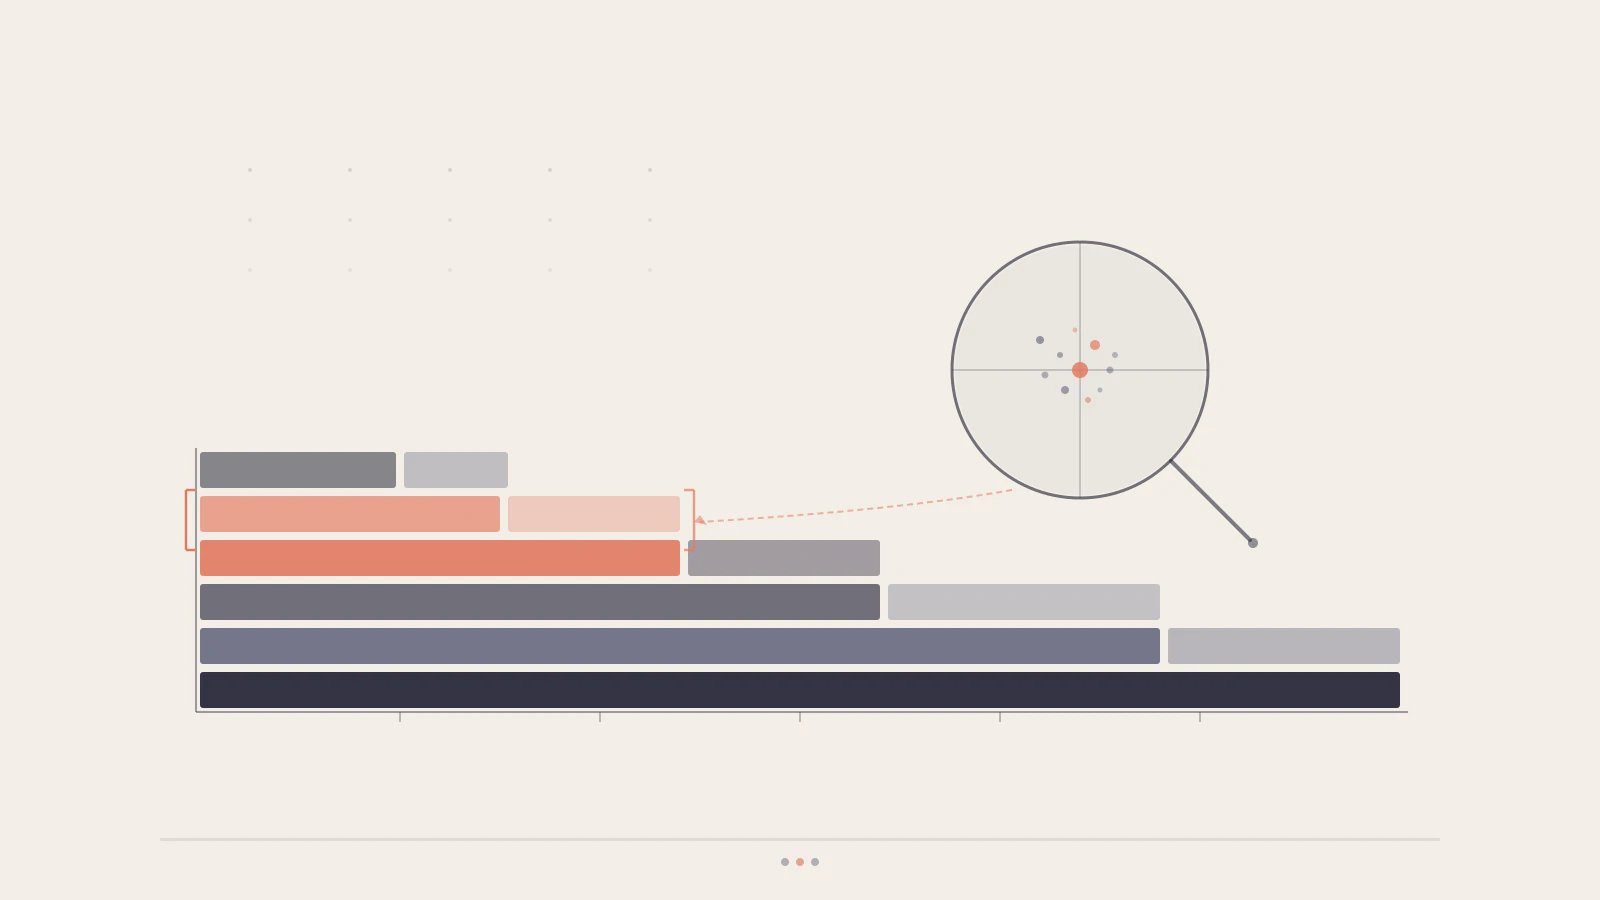
A flamegraph: wider bars mean more CPU time. The accent-coloured bar is the hot function — the one your profiler is pointing at.
Check the database slow query log
Not every slow endpoint is CPU-bound. A lot of production slowness traces back to the database — a missing index, a query that scans the full table, or an N+1 pattern that fires dozens of small queries per request.
Most databases have a slow query log that records queries exceeding a threshold.
In PostgreSQL, enable it in postgresql.conf (or via ALTER SYSTEM):
log_min_duration_statement = 100  # log queries taking > 100ms
log_statement = 'none'            # log only slow ones, not all
Then reload:
SELECT pg_reload_conf();The slow query log entries look like:
2025-11-08 14:32:01 UTC [12345] LOG: duration: 2340.829 ms
  statement: SELECT * FROM posts WHERE user_id = $1
  ORDER BY created_at DESC
Two seconds for a query that should take milliseconds. That’s your culprit.
Add EXPLAIN ANALYZE to the front of the query and run it manually:
EXPLAIN ANALYZE SELECT * FROM posts WHERE user_id = $1 ORDER BY created_at DESC;If you see Seq Scan where you expect an Index Scan, the index either doesn’t exist or the query planner isn’t using it. Adding an index on (user_id, created_at DESC) is usually the fix.
For MySQL, the equivalent is:
SET GLOBAL slow_query_log = 'ON';
SET GLOBAL long_query_time = 0.1;
The N+1 problem is harder to spot in the slow query log because each individual query is fast. The tell is a large number of identical queries with different parameter values appearing within the same request lifecycle. If you see 47 queries of the form SELECT * FROM tags WHERE post_id = $1 in a single request, that’s N+1. The fix is to join or batch the lookup — one query that fetches all tags for all posts in the response at once.
A complete profiling walkthrough
Here’s how the full process looks end to end for a Node.js/Express endpoint.
Step 1: Confirm it’s server-side. Check TTFB in the network tab. If TTFB is over 500ms for a simple data endpoint, the problem is on the server.
Step 2: Enable profiling under load. Start Node.js with --prof. Send load to the endpoint with ab or wrk:
node --prof server.js &
ab -k -c 10 -n 200 http://localhost:3000/api/posts
Step 3: Process the tick file.
node --prof-process isolate-0x*.log > profile.txt
cat profile.txt | head -60
Look at the [Summary] and [C++] sections first. If crypto, JSON, or a specific library call consumes the top of the list, you have a direction.
Step 4: Verify with the database log. Enable the slow query log and run the same load. If queries appear, they’re part of the problem. Fix them first — a missing index is the cheapest fix you’ll make.
Step 5: Validate with clinic.js. Clinic.js wraps your Node.js process and adds automated diagnostics. Its doctor tool identifies event loop blocking, CPU saturation, and I/O bottlenecks without requiring you to interpret raw tick output manually:
npx clinic doctor -- node server.jsRun load while clinic.js watches. When you stop, it opens an HTML report in your browser with annotated recommendations. If the event loop is blocked, the report shows it directly. If I/O wait is the issue, it shows that too. It’s the fastest way to confirm which category of problem you’re dealing with before diving deeper.
Step 6: Fix and compare. After each change, rerun the load test and compare p95 latency. Don’t declare victory until you’ve measured the improvement under the same conditions.
When profiling is overkill
Profiling is the right tool when you don’t know where the problem is. It’s unnecessary when the answer is already obvious.
If your server logs show a database query taking 2 seconds, you don’t need a flamegraph. Fix the index and measure the result.
If a new dependency you just added handles a large amount of synchronous computation on every request, that’s the problem. Remove it or move the work to a worker thread.
| Situation | What to do first |
|---|---|
| No idea where the slowness is | Capture a CPU profile, generate a flamegraph |
| High TTFB, no slow queries | Profile the CPU, check event loop blocking |
| Slow queries visible in the log | Fix the query or index before profiling |
| Slowness appeared after a specific deploy | Check what changed, narrow to new code paths |
| Gradual slowdown over weeks | Check data growth, table bloat, missing index on a growing column |
| Fast locally, slow in production | Check connection pool limits, cold starts, and memory pressure |
The table above is a starting point, not a rule. Production problems are often a combination of factors — a missing index that was fine at 10k rows but breaks at 1M, combined with an event loop that’s occasionally blocked by a synchronous JSON parse on large payloads. Profiling often reveals the second problem only after you’ve fixed the first.
Profile before you guess, then trust the data
The instinct when something is slow is to make it faster through reasoning: “this query probably needs an index,” “this serialization is probably expensive,” “this library is probably slow.” Sometimes that instinct is right. But guessing before profiling means you’re equally likely to optimise something that wasn’t the bottleneck, while the real problem stays in place.
The workflow in this post — RUM data to confirm real user impact, CPU profiling to find the hot path, slow query logs to find database problems, clinic.js to validate — takes maybe 30 minutes to run through. That’s 30 minutes before you write a single line of fix code. The trade-off is worth it.
One important limitation: profiling adds overhead. The --prof flag and clinic.js both slow the process slightly while they’re active. Don’t leave profiling flags on permanently in a production environment under high traffic. Run them for a bounded window, collect the data, and remove the flags.
The goal isn’t to profile everything constantly. It’s to profile precisely when something is wrong, find the cause, and then get out.